
The estimated reading time for this post is 400 seconds
Revenue is often the headline number in a company’s financial performance. It appears in earnings releases, board presentations, investor updates, and monthly management reports.
But for FP&A teams, revenue alone rarely tells the complete story.
A company can increase sales while margins deteriorate, cash becomes constrained, customer acquisition costs rise, or operating expenses grow faster than the business. That is why modern FP&A metrics need to go beyond top-line growth.
The shift is becoming more important as finance teams take on a larger strategic role. Deloitte’s Q4 2025 CFO Signals survey found that 50% of North American CFOs identified digital transformation of finance as their top priority for 2026, while 87% said artificial intelligence would be extremely or very important to finance operations.
For finance leaders, better technology is only useful if teams are measuring the right things.
1. Gross Margin
Revenue shows how much a company sells. Gross margin shows how much remains after the direct costs associated with producing those sales.
The basic calculation is:
Gross Margin = (Revenue − Cost of Goods Sold) ÷ Revenue
A business can report strong revenue growth while gross margin declines because of higher input costs, discounting, pricing pressure, or changes in product mix.
FP&A teams should therefore monitor gross margin by product, customer segment, geography, or business unit where the data allows.
This helps management determine whether growth is actually creating economic value.
2. Operating Expense Growth
Revenue growth should be evaluated alongside operating expenses.
FP&A teams should track spending on areas such as payroll, sales and marketing, technology, research and development, and corporate overhead.
The key question is not simply whether expenses are increasing. It is whether expenses are growing faster than the business can support.
For example, a company growing revenue by 8% while operating expenses rise 15% may face increasing pressure on operating margins.
This makes operating expense growth an important early-warning metric.
Deloitte’s Q1 2026 CFO Signals survey found that 52% of surveyed North American CFOs identified cost management as their most worrisome internal concern.
3. Free Cash Flow
Profit and cash flow are not interchangeable.
Free cash flow provides a view of how much cash remains after the company funds its capital expenditures.
A simplified calculation is:
Free Cash Flow = Operating Cash Flow − Capital Expenditures
For FP&A teams, this metric is particularly useful when evaluating investment capacity.
Strong free cash flow can provide flexibility for debt repayment, acquisitions, dividends, technology investments, or other strategic initiatives.
A company with growing revenue but consistently weak free cash flow may require closer examination of working capital, capital spending, or operating costs.
4. Cash Conversion Cycle
Working capital can consume cash even when a company’s income statement looks healthy.
The cash conversion cycle (CCC) measures how long it takes a company to convert investments in inventory and other operating resources into cash collected from customers.
It is commonly evaluated through three components:
- Days Inventory Outstanding
- Days Sales Outstanding
- Days Payables Outstanding
A rising CCC can signal that more cash is becoming tied up in operations.
For CFOs, monitoring the trend can help identify opportunities to improve collections, inventory management, and supplier payment strategies.
5. Forecast Accuracy
An FP&A team’s forecast is only useful if management can understand how reliable it is.
That makes forecast accuracy one of the most important FP&A metrics to track. For finance leaders, this measure provides an important test of whether planning assumptions are keeping pace with changing business conditions.
Teams can compare forecasted revenue, expenses, EBITDA, cash flow, or other KPIs against actual results.
The objective is not to achieve perfect forecasts. Business conditions will always change.
Instead, finance teams should identify recurring forecasting errors and determine whether they come from unrealistic assumptions, poor data, changing customer behavior, or operational execution.
Better forecast accuracy can make budgeting and resource allocation more effective.
6. EBITDA Margin
EBITDA margin provides another perspective on operating performance.
EBITDA Margin = EBITDA ÷ Revenue
Tracking the margin rather than EBITDA alone allows FP&A teams to evaluate profitability relative to the size of the business.
If revenue rises but EBITDA margin falls, management may need to investigate pricing, labor costs, production expenses, or other operating pressures.
For companies with different business units, EBITDA margin can also help compare operating performance across segments.
7. Working Capital
Working capital metrics are particularly important for companies experiencing rapid growth.
FP&A teams can monitor accounts receivable, accounts payable, inventory, and other short-term operating assets and liabilities.
The objective is to understand whether growth is consuming more cash than expected. FP&A metrics can help finance teams monitor these changes and identify when stronger revenue growth is putting unexpected pressure on liquidity.
A business that adds customers rapidly may need to finance additional inventory, employees, receivables, or infrastructure before it collects the associated revenue.
That makes working capital a critical link between growth and liquidity.
8. Customer Acquisition Cost and Customer Economics
Revenue growth can sometimes hide inefficient customer acquisition.
For subscription, technology, retail, and other customer-driven businesses, FP&A teams should monitor Customer Acquisition Cost (CAC) alongside customer lifetime value, retention, churn, and gross margin.
CAC answers a straightforward question: how much does the company spend to acquire a customer?
When combined with retention and profitability data, it gives management a better understanding of whether growth is economically sustainable.
Revenue is therefore only one part of the customer equation.
9. Return on Investment
Finance teams increasingly evaluate investments in technology, automation, artificial intelligence, and other strategic initiatives.
That makes return on investment (ROI) an increasingly important FP&A metric.
Deloitte’s Finance Trends 2026 research found that 63% of surveyed finance teams had fully deployed and actively used AI solutions, but only 21% reported clear, measurable ROI.
That gap illustrates an important challenge for finance leaders.
Adoption does not automatically equal value.
FP&A teams should track the financial impact of major investments and compare expected benefits with actual results.
Building a Better FP&A Dashboard
The strongest FP&A dashboards do not contain dozens of disconnected KPIs.
The most useful FP&A metrics should connect financial results with the operational drivers behind them. This allows executives to move from simply reviewing numbers to understanding what is driving performance.
Instead, they connect financial performance with operational drivers.
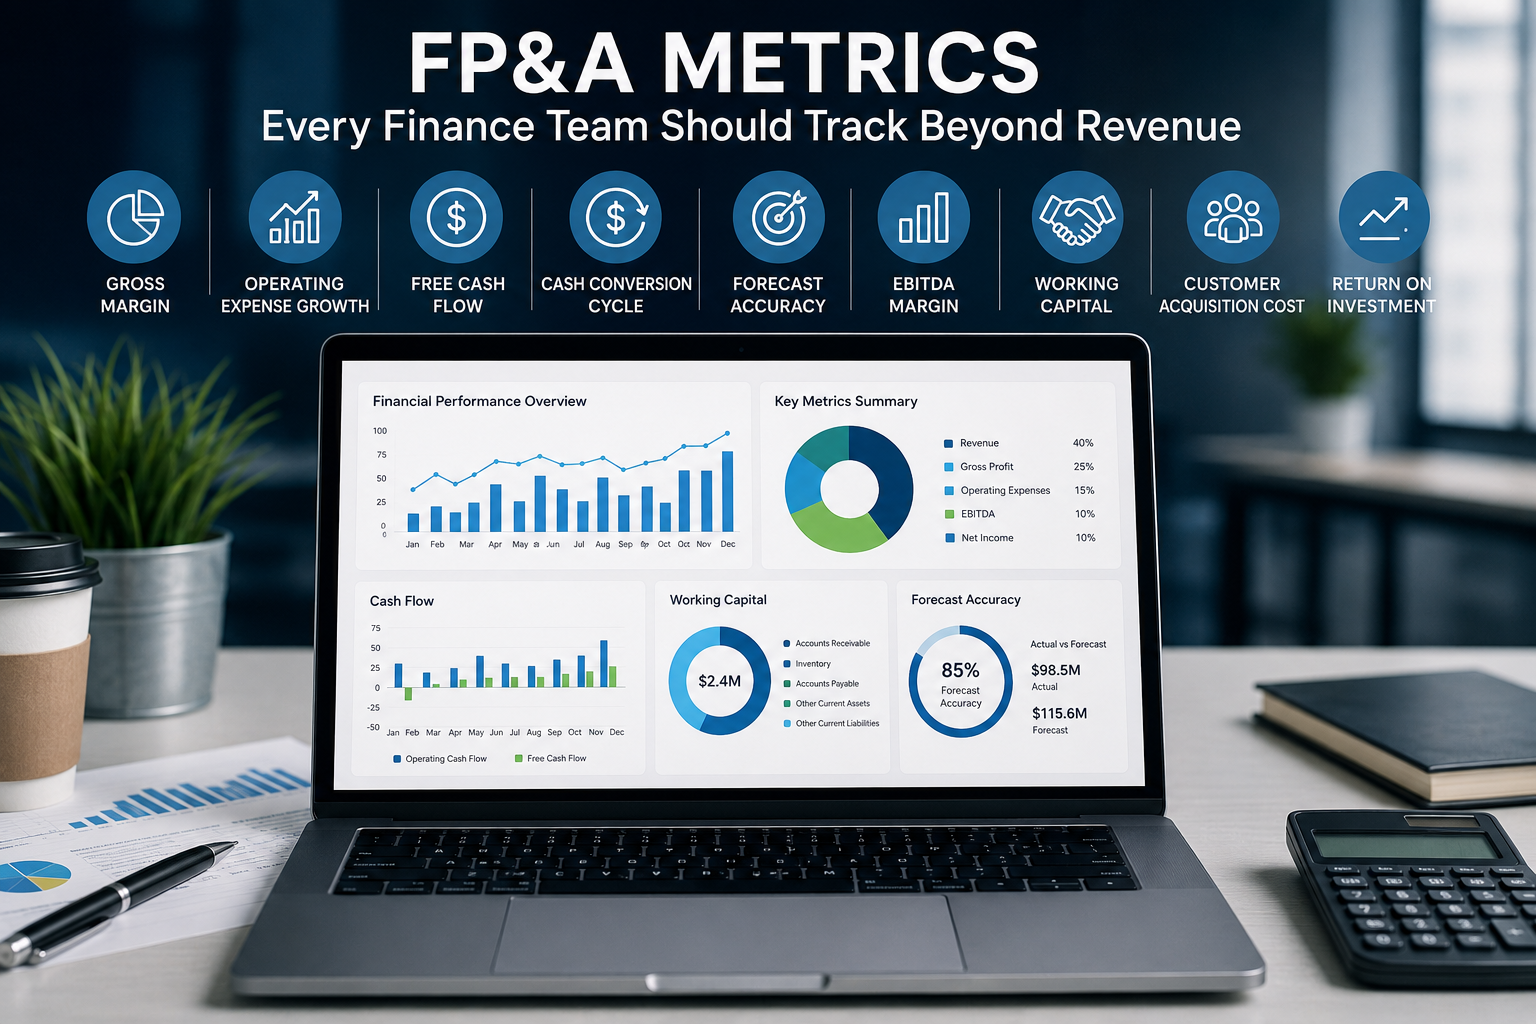
A useful executive dashboard might combine:
| Metric | What It Tells Management |
|---|---|
| Revenue Growth | Whether sales are expanding |
| Gross Margin | Whether growth is profitable |
| Opex Growth | Whether costs are under control |
| Free Cash Flow | How much cash the business generates |
| Cash Conversion Cycle | How efficiently working capital is managed |
| Forecast Accuracy | How reliable financial planning is |
| EBITDA Margin | Underlying operating profitability |
| CAC | Cost of acquiring customers |
| ROI | Whether investments create value |
The exact mix should depend on the company’s business model. A manufacturing company may emphasize inventory and working capital, while a software company may focus more heavily on recurring revenue, churn, CAC, and customer economics.
Read more: Rolling Forecasts vs. Annual Budgets: The Benefits of Both
Why FP&A Metrics Matter More in 2026
Finance teams are increasingly expected to provide forward-looking insight rather than simply report historical performance.
Deloitte’s 2026 research found that 57% of surveyed finance leaders play a leading role in shaping enterprise strategy.
That strategic role makes KPI selection more important.
The right FP&A metrics can help CFOs identify margin pressure, anticipate cash requirements, challenge investment assumptions, and understand whether growth is creating sustainable value. Tracking these FP&A metrics consistently also gives finance teams a clearer framework for improving forecasts and supporting strategic decisions.
Revenue will always matter.
But revenue is only the starting point.
For modern finance teams, the more important question is what happens underneath the top line—and whether those underlying trends point toward stronger profitability, healthier cash flow, and better long-term performance.
Sources
- Deloitte, Q4 2025 CFO Signals Survey, January 2026. Read the Deloitte report
- Deloitte, Q1 2026 CFO Signals Survey, April 2026. Read the Deloitte report
- Deloitte, Finance Trends 2026, October 2025. Read the Deloitte report
- Deloitte, Beyond the Numbers: How an AI-enabled FP&A Is Transforming Finance, June 2026. Read the Deloitte FP&A report